Understanding your gaming system’s behavior under load requires proper monitoring and optimization tools. From
tracking temperatures and clocks to adjusting fan curves and overclocking, the right utilities provide visibility
into hardware operations that distinguish stable systems from problematic ones. Fortunately, excellent tools are
available completely free for all gamers.
Many gamers overlook system monitoring until problems occur—stuttering, crashes, or thermal throttling that could
have been identified and addressed earlier with proper visibility. Proactive monitoring enables optimization
opportunities and early warning of potential issues.
This comprehensive guide covers essential free PC optimization and monitoring tools for gaming in 2026. We’ll explain
what each tool does, how to configure it properly, and when to use each utility for maximum benefit.
I. System Monitoring Tools
These tools provide visibility into hardware behavior—temperatures, clocks, utilization, and power consumption.
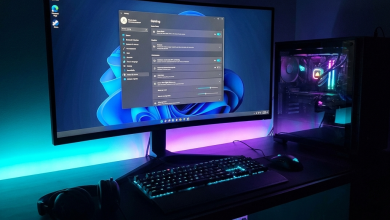
HWiNFO – Best Comprehensive Monitor
HWiNFO stands as the gold standard for system monitoring, providing the most comprehensive hardware sensor reading
available. Every temperature sensor, voltage rail, power measurement, and utilization metric your system exposes
appears in HWiNFO.
Key Features:
- Real-time monitoring of all hardware sensors
- Minimum, maximum, and average value tracking
- Logging to CSV for performance analysis
- OSD integration with RTSS for in-game overlay
- Customizable alerts for temperature thresholds
- Detailed hardware specifications
Essential Sensors to Monitor:
- CPU: Package temperature, core temperatures, power draw
- GPU: GPU temperature, hot spot temperature, power draw, VRAM temperature
- Storage: SSD/HDD temperatures, health status
- Memory: Speeds and timings
Configuration Tips:
- Launch HWiNFO in “Sensors-only” mode for monitoring
- Right-click sensors to hide ones you don’t need
- Configure to minimize to system tray
- Set up alerts for temperature thresholds (e.g., GPU >90°C)
Download: hwinfo.com (free for personal use)
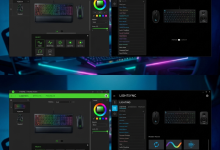
MSI Afterburner – Best GPU Tool
MSI Afterburner provides GPU monitoring and overclocking in one comprehensive package. Despite the MSI branding, it
works with all graphics cards from any manufacturer. The RivaTuner Statistics Server (RTSS) integration enables
in-game overlays.
Key Features:
- GPU core clock and memory clock adjustment
- Power limit and voltage control
- Custom fan curves for thermal optimization
- In-game overlay showing FPS, temps, utilization
- Benchmarking tools
- OC profile saving and hotkeys
Setting Up In-Game Overlay:
- Install MSI Afterburner with RTSS (included in installer)
- Open Afterburner Settings → Monitoring tab
- Select metrics you want on overlay (FPS, GPU temp, CPU temp, etc.)
- Check “Show in On-Screen Display” for each selected metric
- Configure appearance in RTSS settings
Fan Curve Configuration:
- Open Settings → Fan tab
- Enable “User defined software automatic fan control”
- Adjust curve: low temps = low fan speed, high temps = high fan speed
- Balance between cooling and noise based on preference
Download: msi.com/landing/afterburner or guru3d.com
GPU-Z – GPU Information
GPU-Z provides detailed graphics card specifications and real-time monitoring in a lightweight package. While MSI
Afterburner includes monitoring, GPU-Z offers superior specification details and sensor stability.
Key Features:
- Complete GPU specifications (VRAM, shaders, clocks, etc.)
- Real-time sensor monitoring
- BIOS version and PCIe slot info
- Graphics driver version
- Power consumption and thermal monitoring
Useful Applications:
- Verify GPU specifications match expectations (especially used purchases)
- Check PerfCap (performance cap) reasons during bottleneck analysis
- Monitor VRAM usage during gaming
- Verify PCIe link speed and width
Download: techpowerup.com/gpuz/
CPU-Z – CPU Information
CPU-Z provides comprehensive processor, motherboard, and memory specifications. Essential for verifying system
configurations and memory settings.
Key Features:
- Detailed CPU specifications (cores, cache, stepping, etc.)
- Real-time core frequency monitoring
- Memory type, frequency, and timings
- Motherboard model and chipset
- SPD (memory module) information
Useful Applications:
- Verify CPU is running at expected frequencies
- Check memory is running at XMP/EXPO speeds
- Identify motherboard for driver/BIOS updates
- Benchmark comparison with validated results
Download: cpuid.com/softwares/cpu-z.html
II. Benchmarking Tools
Benchmarks provide standardized testing for performance comparison and stability verification.
3DMark – Industry Standard Gaming Benchmark
3DMark remains the industry standard for graphics performance testing. The free “Basic” edition includes essential
tests for comparing system performance against others.
Key Tests:
- Time Spy: DirectX 12 benchmark for modern gaming
- Fire Strike: DirectX 11 benchmark for broader comparison
- CPU Profile: Multi-threaded CPU performance
Uses:
- Compare performance against similar systems
- Verify overclock stability
- Baseline performance before/after changes
- Identify underperforming components
Download: Steam (free Basic edition) or 3dmark.com
Cinebench R23 – CPU Benchmark
Cinebench tests CPU rendering performance, providing multi-core and single-core scores. Useful for verifying CPU
performance meets expectations.
Key Tests:
- Multi-Core: All cores under load
- Single-Core: Single-threaded performance (important for gaming)
Uses:
- Verify CPU performing to specification
- Test thermal throttling under sustained load
- Compare before/after overclocking
Download: maxon.net/cinebench
CrystalDiskMark – Storage Benchmark
CrystalDiskMark tests storage read/write speeds, verifying SSD performance matches specifications.
Key Metrics:
- Sequential Read/Write: Large file transfer speeds
- Random 4K: Real-world application performance
- Queue Depth variations: Multi-threaded access performance
Uses:
- Verify new SSD performs as expected
- Identify aging drives losing performance
- Compare different drive configurations
Download: crystalmark.info
III. System Utilities
These utilities help maintain and optimize system operation.
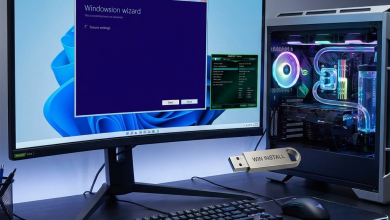
Display Driver Uninstaller (DDU) – Clean Driver Removal
DDU completely removes graphics drivers, enabling clean installations that resolve driver conflict issues. Essential
when switching GPU brands or troubleshooting driver problems.
Key Features:
- Complete driver removal (files, registry, folders)
- Safe Mode operation for thorough cleaning
- Supports NVIDIA, AMD, and Intel drivers
- Prevents Windows from automatically reinstalling
Usage Process:
- Download new drivers but don’t install yet
- Boot into Windows Safe Mode
- Run DDU, select GPU manufacturer
- Choose “Clean and shutdown”
- Power on and install fresh drivers
Download: guru3d.com/files-details/display-driver-uninstaller-download.html
RTSS (RivaTuner Statistics Server) – Frame Rate Control
RTSS provides precise frame rate limiting superior to in-game or driver caps. Bundled with MSI Afterburner but
valuable independently.
Key Features:
- Precise frame rate limiting (less variance than driver caps)
- Customizable on-screen display
- Frame time analysis and monitoring
- Per-application profiles
Why Use RTSS Frame Limiting:
- More consistent frame pacing than in-game limiters
- Reduces input latency compared to V-Sync
- Keeps FPS within G-Sync/FreeSync range
- Lower GPU power/heat when limiting below max FPS
Configuration:
- Open RTSS from system tray
- Set Framerate limit to monitor refresh rate minus 3-4
- Or create per-game profiles with specific limits
Download: guru3d.com (included with MSI Afterburner)
NVCleanstall – Minimal NVIDIA Driver Installation
NVCleanstall enables installing only needed NVIDIA driver components, skipping telemetry and unwanted features.
Results in cleaner installation with smaller footprint.
Key Features:
- Select individual driver components
- Remove telemetry components
- Skip GeForce Experience if not wanted
- Apply tweaks during installation
Recommended Components:
- Display Driver (required)
- HD Audio (if using HDMI/DP audio)
- PhysX (if games use it)
- Skip: Telemetry, ShadowPlay (if using OBS instead), etc.
Download: techpowerup.com/nvcleanstall/
IV. Tools Comparison Table
| Tool | Primary Use | Essential For |
|---|---|---|
| HWiNFO | System Monitoring | All Gamers |
| MSI Afterburner | GPU Control & OSD | All Gamers |
| GPU-Z | GPU Specifications | Troubleshooting |
| CPU-Z | CPU/Memory Info | Troubleshooting |
| 3DMark | Benchmarking | Performance Testing |
| DDU | Driver Cleaning | Driver Issues |
| RTSS | Frame Rate Control | Adaptive Sync Users |
V. Setting Up Complete Monitoring
An integrated monitoring setup provides comprehensive visibility during gaming.
Recommended Setup
- Install HWiNFO for comprehensive sensor data
- Install MSI Afterburner + RTSS for GPU control and overlay
- Configure RTSS overlay to display key metrics during gaming
- Set up HWiNFO + RTSS integration for maximum sensor access in overlay
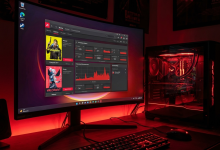
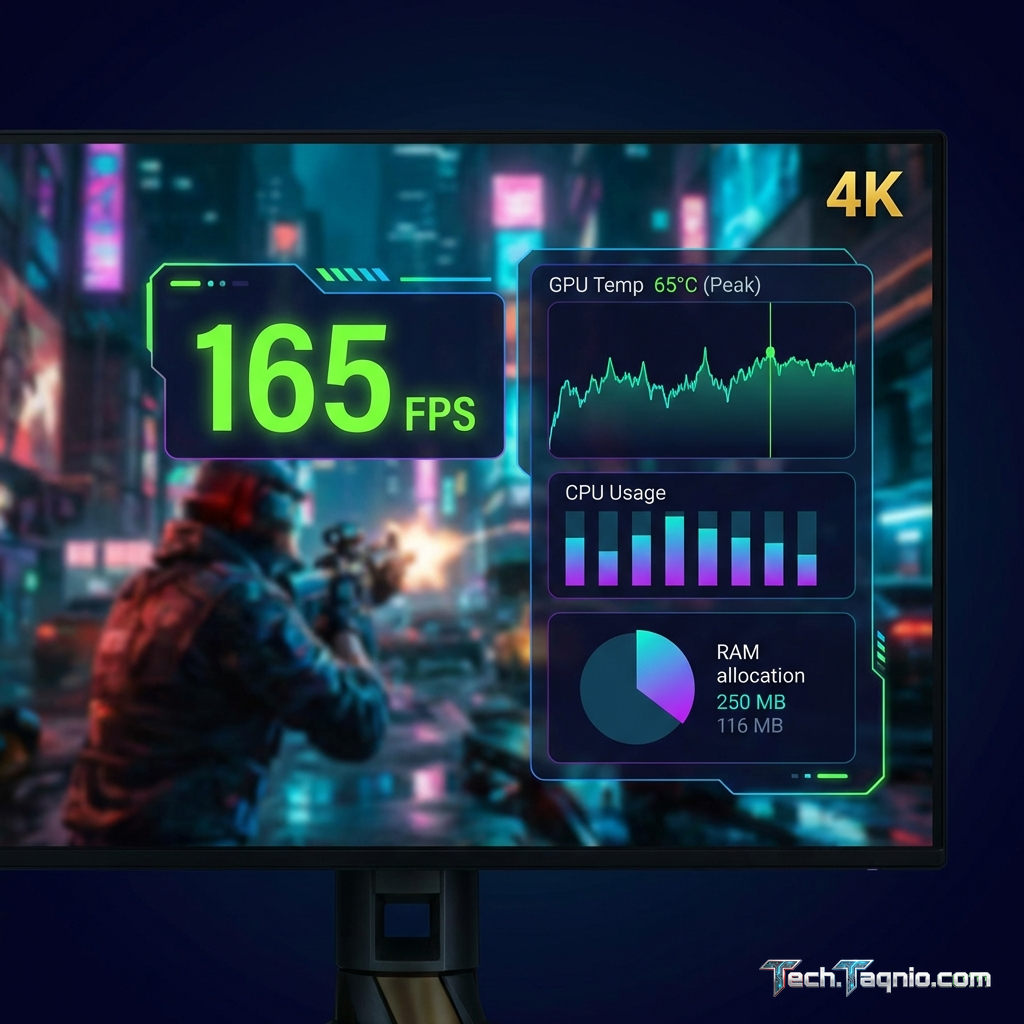
In-Game Overlay Configuration
Essential metrics to display during gaming:
- FPS: Current frame rate
- Frame Time: Consistency of frame delivery
- GPU Temperature: Thermal status
- GPU Usage: Identify GPU bottleneck
- CPU Temperature: Thermal status
- CPU Usage: Identify CPU bottleneck
- VRAM Usage: Memory pressure
Position overlay in corner where it doesn’t obstruct gameplay. Reduce font size if overlay seems too prominent.
VI. Interpreting Monitoring Data
Understanding what monitoring data indicates helps optimize your system.
Temperature Guidelines
CPU Temperatures:
- Under 70°C under load: Excellent
- 70-85°C under load: Normal for gaming
- 85-95°C under load: Warm, consider improved cooling
- 95°C+: Throttling likely, address cooling
GPU Temperatures:
- Under 70°C under load: Excellent
- 70-80°C under load: Normal
- 80-90°C under load: Warm but typically safe
- 90°C+: Hot, consider case airflow improvement
Identifying Bottlenecks
GPU Bottleneck (normal for gaming): GPU usage 95-99%, CPU usage below 80%. This is ideal—your GPU is
fully utilized.
CPU Bottleneck: GPU usage significantly below 95%, one or more CPU cores at 100%. GPU waiting on
CPU—consider CPU upgrade or settings changes.
VII. Conclusion
Free system utilities provide all the monitoring and optimization capability most gamers need. HWiNFO and MSI
Afterburner form the essential core—every gaming system benefits from their visibility and control.
Start with HWiNFO and MSI Afterburner for comprehensive monitoring, add GPU-Z and CPU-Z for detailed specifications,
and use DDU when driver issues arise. The investment of time learning these tools pays dividends in system
optimization and troubleshooting capability.
Regular monitoring during gaming helps identify issues early—temperatures creeping up, utilization patterns changing,
or performance degrading. Proactive attention prevents problems from becoming failures.
For complete gaming guidance, explore our articles on Windows 11 gaming optimization and
best CPU coolers for gaming.